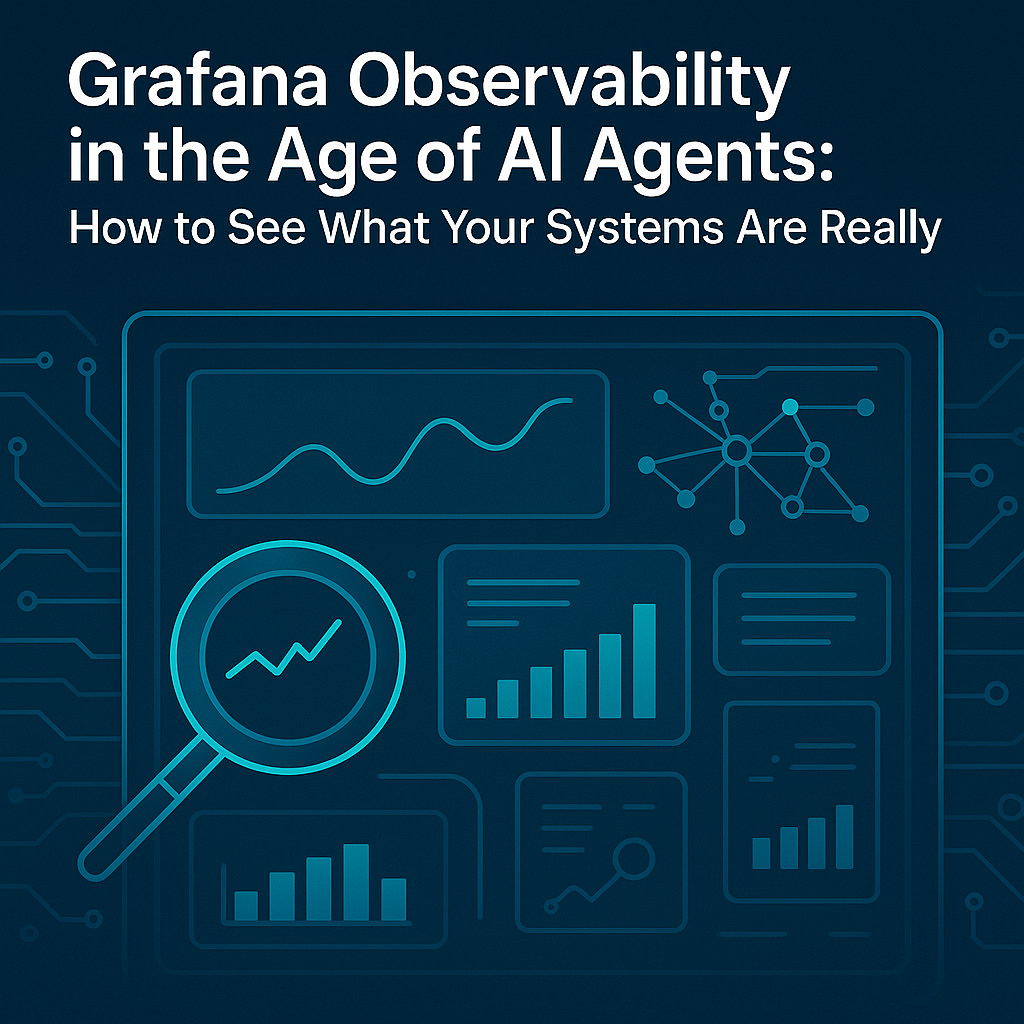
Grafana observability matters more now because AI agents are writing code, shipping changes, and poking at systems without much human hand-holding. That raises...
Grafana observability matters more now because AI agents are writing code, shipping changes, and poking at systems without much human hand-holding. That raises the bar. You need clearer signals, faster checks, and better proof that the system still behaves like it should. I’m Ermenildo V Castro, and I’ve seen enough messy production incidents to know this: if you can’t explain what changed, you’re already behind.
Key Takeaways
- Grafana observability helps teams see metrics, logs, traces, and alerts in one place.
- AI agents make software faster to change, but also harder to reason about.
- Good observability is about cause and effect, not just pretty charts.
- The best setups mix OpenTelemetry, clear dashboards, and sane alert rules.
- Teams that treat observability as a work habit, not a rescue tool, sleep better.
What is Grafana observability?
Grafana observability is the practice of using Grafana and related tools to understand what a system is doing in real time. It brings together metrics, logs, traces, and alerts so teams can spot failures, trace root causes, and check whether changes actually helped or hurt. That sounds simple. It rarely is.
Grafana started as a dashboard tool, but it grew into a full observability stack. With Grafana Cloud, Loki for logs, Tempo for traces, and Prometheus for metrics, you can connect the usual mess of signals into one view. The point is not decoration. The point is truth.
I’ve worked in places where teams had five tools for the same problem, and none of them agreed. One dashboard said the service was healthy. Another said latency was ugly. A log search showed a timeout buried in a retry storm. Which one was right? All of them, in part. That is why observability exists.
Now AI agents make this more urgent. When an agent opens a pull request, changes config, deploys a fix, or spins up a job, the old “who touched this?” question gets fuzzy. You need traces that show the request path, logs that explain the odd branch, and metrics that prove the blast radius. In practice, that means observability becomes a form of stewardship. You are not just keeping systems alive. You are protecting users, time, and trust.
If you want a clean technical baseline, Grafana pairs well with OpenTelemetry. The OpenTelemetry project gives you a vendor-neutral way to collect telemetry from apps, services, and agents. Grafana then gives you the eyes to read it. That combo beats guessing. Every time.
For the formal product docs, see the Grafana documentation and the OpenTelemetry documentation. Both are worth your time. The hype is not.
Core benefits of Grafana observability
Grafana observability has a few clear strengths, and most of them show up when something breaks at 2 a.m. That is when theory stops being cute.
- One place for many signals
- I’ve seen teams waste hours hopping between tools. Grafana cuts down that thrash by putting metrics, logs, and traces in one place.
- That means less swivel-chair work, which is a fancy way of saying less nonsense.
- Faster root cause analysis
- A spike in latency is not helpful by itself.
- With Grafana, you can jump from a graph to the trace to the log line, and the answer often becomes obvious before your coffee gets cold.
- Better incident response
- During outages, speed matters, but clarity matters more.
- I’ve been on incident calls where everyone had opinions and no proof. Grafana helps replace shouting with facts.
- Works well with distributed systems
- Microservices, queues, background jobs, and AI agents all create scattered behavior.
- Observability stitches that behavior back together so humans can see the pattern.
- Open source roots
- Grafana’s ecosystem has a big community, solid docs, and a lot of shared practice.
- That matters because closed tools can lock you into one vendor’s view of reality.
- Supports sane decision-making
- Good charts help teams judge whether a release helped customers or just made a dashboard look busy.
- In my Amazon days, I learned that a “successful deployment” means nothing if user pain goes up.
- Fits AI-era systems
- AI agents can create subtle failures: bad prompts, malformed API calls, runaway retries, silent config drift.
- Grafana helps you catch those weak spots before they turn into expensive headaches.
Here’s the kicker: observability is not only for emergencies. It also helps with everyday work, like capacity planning, release checks, and cost control. That is where a lot of teams miss the point. They install the tools, then wait for disaster. That’s backward.
For deeper context on open telemetry standards, the OpenTelemetry observability primer is useful. It explains why signals matter together, not alone.
Step-by-step guide to setting up Grafana observability
Setting up Grafana observability is not magic. It is a sequence. Skip steps, and you get a fancy mess.
- Define what you need to see
- Start with user-facing services, critical jobs, and the agent workflows that can cause harm if they go sideways.
- I always tell teams to begin with business pain points, not with tool features.
- If you can’t name the failure mode, you’re collecting telemetry for decoration.
- Instrument your applications
- Add metrics, logs, and traces with OpenTelemetry or native libraries.
- Track request latency, error counts, queue depth, retries, CPU, memory, and agent actions.
- Keep labels useful. Too many tags turn your data into sludge.
- Send telemetry to Grafana-compatible backends
- Use Prometheus for metrics, Loki for logs, and Tempo for traces when the stack fits your needs.
- If you use managed Grafana Cloud, set up the agents and collectors first, then validate the flow.
- Don’t assume data is arriving just because a config file exists. That is rookie thinking.
- Build a small number of strong dashboards
- Make one dashboard for service health, one for error behavior, one for latency, and one for AI agent actions.
- I prefer fewer dashboards with real meaning over a graveyard of widgets nobody reads.
- Use the Grafana dashboards guide to keep the layout clean.
- Create alerts that humans can act on
- Alert on user pain, not vanity metrics.
- A CPU spike may matter, or it may be noise. A rising error rate tied to checkout failures is the real issue.
- Set thresholds with care, and test them before a bad night tests you.
- Trace the AI agent path
- Log prompt IDs, model versions, tool calls, deployment IDs, and rollback events.
- This is where many teams get lazy.
- If an agent changes code, you need a paper trail, even if the paper is digital.
- Review and refine weekly
- Observability gets better when teams ask hard questions after each incident.
- Which signal helped? Which one lied? What was missing?
- That habit turns tools into judgment.
When I worked on large retail systems, we learned that the first dashboard is usually wrong in useful ways. It shows what you thought mattered, not what actually broke. After a few incidents, the real signals emerge. That is normal. Humility helps.
For practical setup details, the Grafana Cloud documentation and the Prometheus overview are solid references.
Comparison table: Grafana observability vs Datadog
Grafana often gets compared with Datadog, which is fair. Datadog is polished and broad. Grafana is flexible, open, and easier to tailor if your team wants control without paying a large bill for every inch of ground.
| Feature | Grafana observability | Datadog |
|---|
| Core model | Open source and modular | Managed SaaS platform |
| Signal types | Metrics, logs, traces, profiles | Metrics, logs, traces, security signals |
| Ecosystem fit | Strong with Prometheus, Loki, Tempo, OpenTelemetry | Strong with Datadog-native agents and integrations |
| Cost control | Often better for teams that want flexibility | Can get pricey at scale |
| Customization | High | Moderate |
| Learning curve | Can be steeper because it is modular | Easier to start, faster out of the box |
| Vendor lock-in | Lower | Higher |
| Best for | Teams that want control and open standards | Teams that want a single managed platform |
The truth is, there is no perfect tool. Datadog is easier for some teams. Grafana is often better for teams that care about ownership, open standards, and building a system they can explain to themselves later.
I’ve seen both approaches work. I’ve also seen both fail when people skipped the basics. Tools do not save bad habits. They just make them visible.
If you want a closer look at supported features, the Datadog product page and the Grafana Cloud product overview are the places to compare.
Common mistakes to avoid
Most observability advice is too pretty. It talks about “insights” and “visibility” like those words pay the bills. They don’t. Bad setups fail for plain reasons, and I’ve seen the same sins again and again.
- Collecting too much data
- Teams often think more telemetry means more truth.
- Not so.
- Too much data creates noise, higher cost, and slower searches.
- Ignoring context
- A metric without service name, region, version, or request ID is often useless.
- You need enough context to connect one event to the next.
- Otherwise, you are staring at a number with no face.
- Using alerts as punishment
- Some teams set alerts for every tiny wiggle.
- That trains engineers to ignore them, which is a dumb game nobody wins.
- Alerts should reflect meaningful user risk.
- Treating dashboards as reports
- A dashboard is not a wall poster.
- It should help you make a choice now.
- If nobody uses it during incidents, scrap it or fix it.
- Forgetting the AI agent layer
- This is the new mistake.
- Teams watch app metrics but ignore the agent that caused the deploy, the code path, or the config change.
- That gap will cost you time.
- Skipping reviews after incidents
- I’ve seen postmortems turn into blame theater.
- That’s useless.
- The real goal is learning, accountability, and cleaner systems.
Frankly, the biggest failure is thinking observability is a tooling problem. It is not. It is a discipline. It is part engineering, part memory, part moral duty to users who trusted your software to work.
If you want to understand alert design better, the Google SRE Book is still one of the best references around.
Frequently asked questions
What makes Grafana observability different from simple monitoring?
Monitoring tells you if something is up or down. Observability helps you explain why. That difference matters more now because systems are messier, and AI agents can change behavior without a human noticing right away.
Is Grafana good for AI agent systems?
Yes, if you instrument it well. Track prompts, tool calls, model versions, deployment IDs, retries, and trace IDs. Without those signals, you are guessing. Guessing is expensive.
Do I need OpenTelemetry with Grafana?
Not strictly, but it is a strong fit. OpenTelemetry gives you a standard way to collect telemetry, and Grafana gives you a practical way to view and analyze it. That pairing reduces lock-in and helps teams keep data portable.
Is Grafana easier than Datadog?
Usually not on day one. Grafana can take more setup because it is modular. But that tradeoff buys flexibility, open standards, and often lower long-term cost. Different teams value different things.
Final thought
Grafana observability is not about making pretty screens. It is about telling the truth about software when the stakes are high and the system has too many moving parts for any one person to hold in their head. I’ve spent years around production systems, from big companies to small teams, and the lesson stays the same: clarity is a form of care. Ermenildo V Castro would call that good stewardship, and I’d agree.
AI agents do not remove the need for observability. They raise it. They make systems faster, but also stranger. That means engineers need better signals, cleaner habits, and more respect for the people affected when software slips. Build the traces. Keep the logs. Watch the metrics. Then review them with honesty. That’s how you serve the common good without fooling yourself.