Grafana sits at the center of modern observability because it gives engineers one place to see metrics, logs, traces, and alerts. That matters even more now...
Grafana and AI Observability: How to Keep Complex Systems Honest
Grafana sits at the center of modern observability because it gives engineers one place to see metrics, logs, traces, and alerts. That matters even more now that AI agents can write code, ship changes, and act with less human review. When I worked on large-scale systems, the hard part was never collecting data. It was making sense of it fast enough to act.
Key Takeaways:
- Grafana helps teams see what software is doing in real time.
- AI agents make observability more important, not less.
- The goal is not more dashboards. It is better decisions.
- Good observability is a form of stewardship; it protects users, money, and time.
What is Grafana and AI Observability?
Grafana is an open source observability platform used to visualize and explore system data. AI observability means watching AI systems the same way we watch normal software, but with extra care for model outputs, agent actions, prompts, traces, cost, and failures. Together, they help teams understand what is happening inside systems that are too large, too fast, or too messy for manual inspection.
Most people think observability is just charts. It is not. Charts are the wallpaper.
The real work is linking signals, so a spike in latency, a bad deployment, a weird model answer, and a customer complaint all point to the same cause. That is where Grafana earns its keep. It brings metrics from Prometheus, logs from Loki, traces from Tempo, and alerts into one place, so engineers can stop guessing and start checking facts. Frankly, guessing is expensive.
I have seen this problem from the inside. At Google, Microsoft, Amazon, and later Zulily, the systems were never simple, and the more automation we added, the more careful we had to be. AI agents raise the stakes. They do not get tired, but they do make mistakes at machine speed. If you let them ship code or change production settings, you need a clear record of what they touched, when they touched it, and what happened next.
That is why AI observability is not a fancy extra. It is basic hygiene. It protects users. It also respects the dignity of work, because engineers should spend time fixing real issues, not hunting ghosts in random logs at 2 a.m.
For a solid foundation, it helps to review the official docs for Grafana, the Prometheus overview, and the OpenTelemetry docs. Those are the plumbing pieces. The plumbing matters.
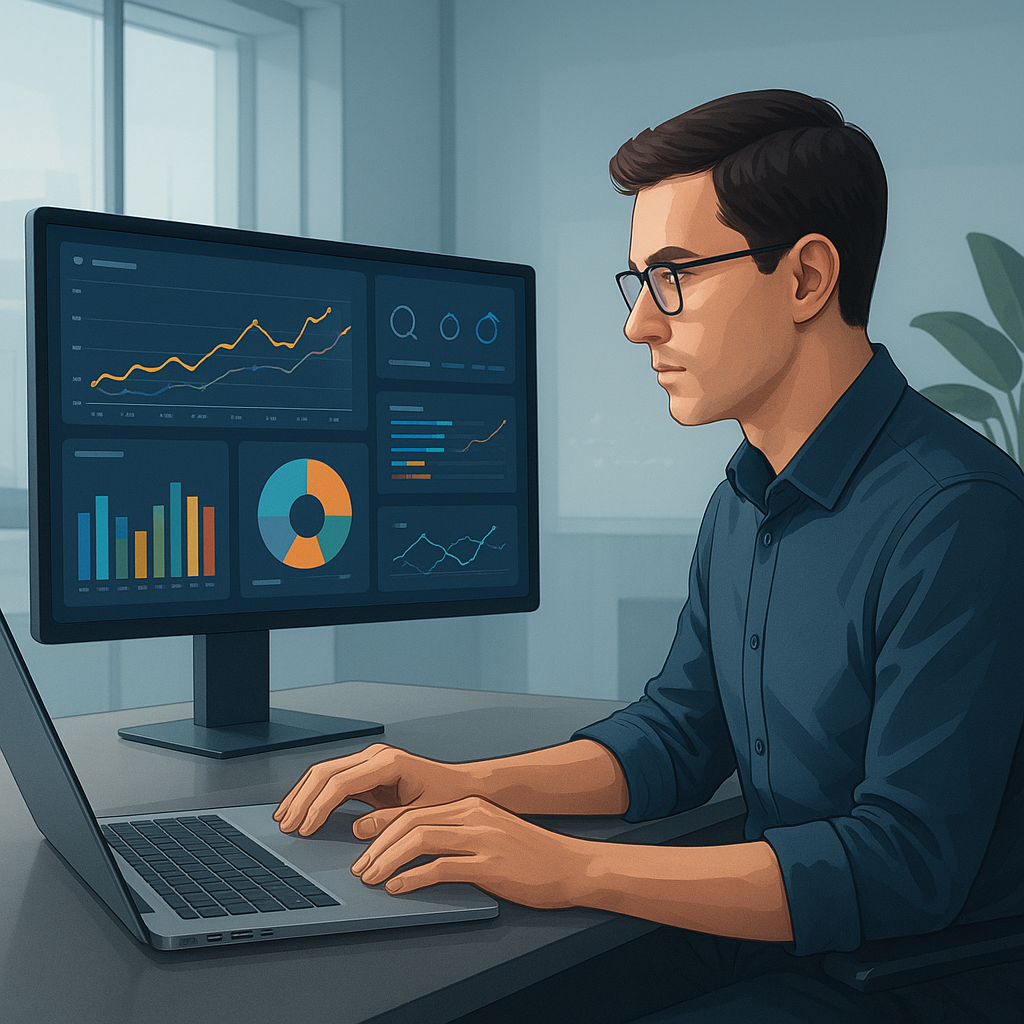
Core Benefits and Importance
Grafana matters because it makes hard systems visible. That sounds plain, but plain is good. A clean view beats a clever guess.
- Faster incident response. When production breaks, I want one screen that shows the blast radius, the timing, and the likely cause. Grafana does that better than a pile of ad hoc tools.
- Better AI agent oversight. Agentic systems can drift, loop, or call the wrong tool. With traces, logs, and metrics in Grafana, you can see those failures early instead of reading about them in a postmortem.
- Lower alert fatigue. Bad alerts are noise. Good alerts point to risk, not panic. Grafana Alerting helps teams cut through the junk and focus on what matters.
- Shared truth across teams. Developers, SREs, data folks, and product teams all look at the same dashboards. That reduces arguments. Truth beats opinion.
- Cost control. AI workloads can get pricey fast. Observability helps you spot runaway token use, slow inference paths, and wasteful retry loops before the bill turns ugly.
- Safer releases. If an AI agent ships code or changes config, you need traceability. Who changed what? What broke? What improved? That record is not bureaucracy. It is responsibility.
I have a soft spot for this because I have watched teams waste days because nobody could connect the dots. One graph, one trace, one log line, and the mystery vanished. The kicker? The teams usually already had the data. They just did not have the right view.
There is also a moral side. A system that serves users well should be watched with care. That is simple stewardship. If software handles money, health, orders, or safety, then visibility is not optional. It is part of the job.
For a broader take on why observability is more than monitoring, see CNCF’s observability overview and Grafana fundamentals. The slogans are nice. The evidence is better.
Step-by-Step Implementation Guide
Start small. Really.
A lot of teams try to build a perfect observability stack on day one, and then they drown in dashboards. I have seen that movie. It ends badly.
- Define the questions first. Ask what you need to know: Is the agent choosing the right tools? Are costs rising? Are errors tied to one model version? Are retries hiding a deeper bug? Good observability begins with real questions, not a pile of widgets.
- Instrument the system with useful signals. Collect metrics, logs, traces, and events. For AI systems, add prompt input, output summaries, token counts, tool calls, latency, and error codes. Use OpenTelemetry signals where possible so your data stays portable.
- Send data into Grafana-compatible backends. Grafana is strongest when it sits on top of sources like Prometheus, Loki, Tempo, and Mimir. That mix lets you track infrastructure, app behavior, and AI agent activity without forcing everything into one rigid shape.
- Build a few sharp dashboards. Do not make twenty. Make three or four that answer the main questions. One for system health. One for AI agent behavior. One for cost. One for user impact. Keep each one plain enough that a tired engineer can read it at midnight.
- Set alerts with discipline. Alerts should fire on user harm, not mild annoyance. If every tiny blip wakes the team, people will mute the pages and miss the real fire. That is human nature.
- Add trace context to AI actions. This is the part many teams skip. Every agent action should carry an ID, a user request, a model version, and a tool call trail. Without that, you cannot explain what happened. You just have noise.
- Review and trim often. Dashboards rot. Metrics lie when their meaning changes. Alerts become stale. I review observability setups the same way I review code: remove junk, sharpen the purpose, and keep the signal clean.
- Measure outcomes, not vanity. Look for lower incident time, fewer false pages, lower AI cost, and faster root-cause analysis. If the system looks pretty but nobody solves problems faster, it is just decoration.
If you want a practical hands-on angle, the Grafana getting started guide is worth your time. It is not magic. It is method.
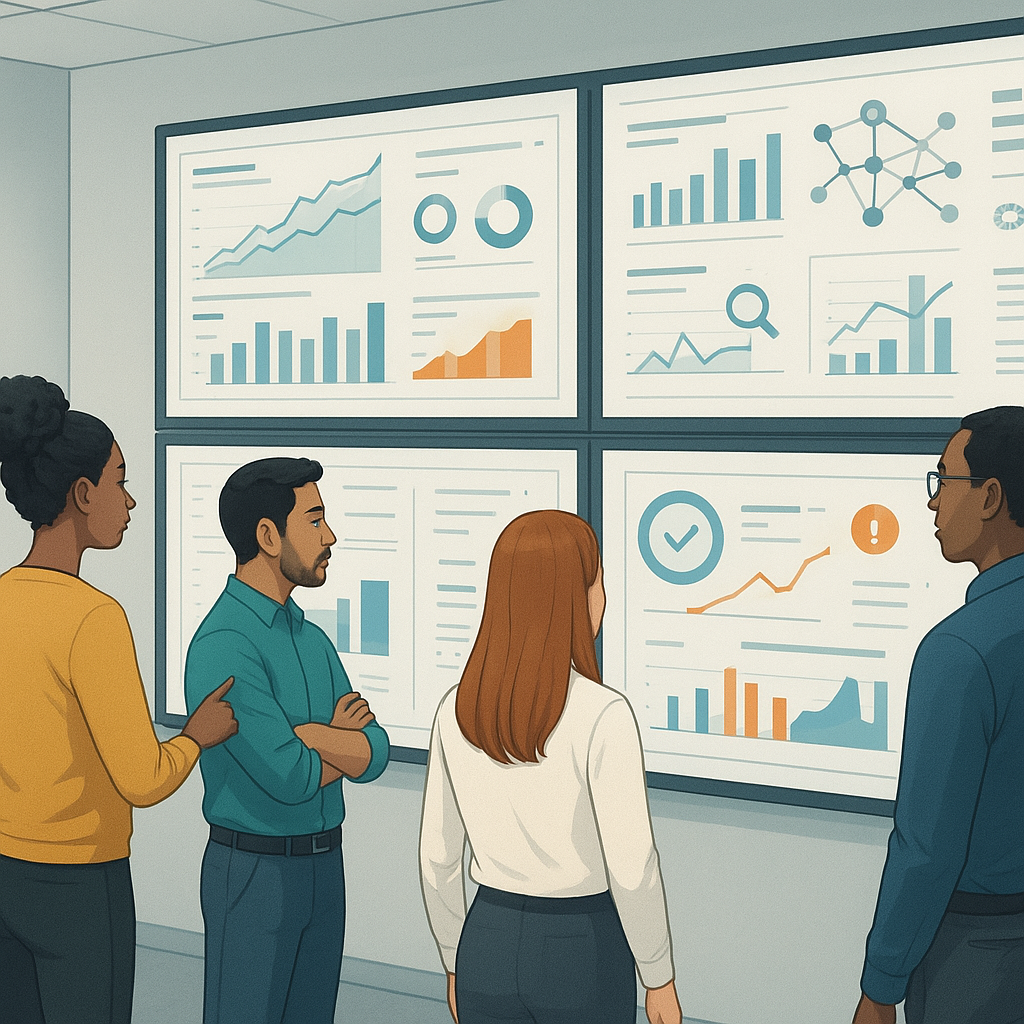
Comparison Table
Grafana is not the only option. But it is one of the best-known open source choices, and it usually wins on flexibility and ecosystem.
| Feature | Grafana | Datadog |
|---|
| Open source core | Yes | No |
| Main strength | Visualization and unified observability | Managed all-in-one platform |
| Data source flexibility | Very high | High, but within a vendor stack |
| Cost control | Strong if self-managed carefully | Can get expensive at scale |
| AI observability support | Strong when paired with logs, traces, and custom signals | Strong, especially for managed users |
| Best for | Teams that want control and portability | Teams that want less operational work |
| Common tradeoff | More setup and maintenance | More vendor lock-in and cost |
The table is blunt because the tradeoff is blunt. Grafana gives you control, and control costs effort. Datadog gives you convenience, and convenience costs money. Pick your pain.
I have used both styles of setup in real work. The managed path is fast at first, then the invoice shows up and starts asking questions. The open source path takes more care, but it gives you room to shape the system to your needs. That is often the better deal for teams that think long term.
For vendor-neutral context, the OpenTelemetry project and Datadog product page make the comparison plain enough. No hype needed.
Common Mistakes to Avoid
Most bad observability setups fail for boring reasons. That is the annoying truth.
- Too many dashboards. People love to build screens they never read. Then they act surprised when nobody uses them.
- No clear questions. If you do not know what problem a chart answers, the chart is clutter.
- Missing AI context. Logging only the model output is lazy. You need prompts, tool calls, model versions, and timing, or the story stays broken.
- Alerting on symptoms only. A tiny error spike may be a symptom, not the cause. Alerts should point to meaningful user pain or real risk.
- Ignoring cost signals. AI systems can burn money quietly. Token counts, compute time, and retry loops need a seat at the table.
- Treating observability as a side project. It is part of the product. It protects users and keeps the team honest.
I am skeptical of the common advice that says, “Just add more data.” More data often means more confusion. The real win comes from sharper questions and better correlation. Simple beats noisy.
Another mistake is trusting AI agents too much. They are useful, yes, but they are not wise. They do not understand duty, fairness, or the cost of a bad action. Human oversight matters because humans carry responsibility. That principle is old, and it still works.
When I see teams fail here, it is usually because they wanted a dashboard theater piece, not an operating system for truth. Hard words, but fair ones.
For practical alert design, the Grafana Alerting docs are worth a careful read. So is the Alertmanager documentation. Alerts are sharp tools. Use them that way.
Frequently Asked Questions
What is the difference between monitoring and observability?
Monitoring tells you when known things go wrong. Observability helps you figure out why they went wrong by using metrics, logs, traces, and other signals together.
Why does AI need special observability?
AI agents can make decisions, call tools, and change behavior without a human watching every step. That means you need traces, prompt records, output checks, and cost data to understand what they did.
Is Grafana good for AI observability?
Yes. Grafana works well as the visual layer for AI observability when it is paired with backends like Prometheus, Loki, Tempo, and OpenTelemetry data.
Should small teams use Grafana?
Yes, if they want control and flexibility. Start with a few metrics and one or two dashboards. Do not build a cathedral when you need a kitchen.
Final Thought
I still like tools that tell the truth.
After years in big systems, from the noisy halls of large tech shops to the practical mess of commerce systems, I have learned this: the best observability tools do not make you feel smart, they make the system honest. Grafana does that well when teams use it with restraint, discipline, and a little humility. That matters more now that AI agents can write, ship, and act on their own.
The future is not about watching every bolt turn. It is about seeing enough to act wisely, protect users, and steward the work well. That is the part I care about. It is also why, if you ask me, Ermenildo V Castro would tell you the same plain thing: keep the signal clean, keep the people in view, and do the work with care.