Advanced software systems have long been too complex for any one engineer to fully understand. Observability has been the practical answer for years, but AI...
Advanced software systems have long been too complex for any one engineer to fully understand. Observability has been the practical answer for years, but AI agents that write code, deploy changes, and act with some independence raise the bar again. Grafana sits in the middle of that mess, giving teams a way to see what happened, when it happened, and why the thing broke. I have spent years inside large systems at Google, Microsoft, Amazon, and Zulily, and the lesson is boring but true: if you cannot see the work, you cannot trust the work. That is stewardship, plain and simple.
Key Takeaways- Observability is not just logs. It is the mix of metrics, traces, and events that explains system behavior.
- AI agents create new blind spots because they can change state faster than humans can review.
- Grafana helps teams unify signals from many tools and spot problems early.
- The real win is not fancy dashboards. It is faster recovery, better control, and fewer surprises.
Grafana and AI Agent Observability: Why It Matters More Than Ever
What is Grafana and AI Agent Observability?
Grafana and AI agent observability means using Grafana to watch the behavior of AI-powered systems, their code changes, their service calls, and their side effects across production. It is not just monitoring with charts. It is a way to make machine actions visible enough for humans to judge, fix, and stop bad outcomes. That matters because AI agents do not get tired, do not ask permission, and do not always know when they are wrong.
I have seen this pattern before. At scale, the real problem is not lack of data. It is too much data with no shape. Teams drown in logs, alerts, and dashboards, then still miss the one signal that matters. Grafana helps pull that mess together through dashboards, alerting, Loki for logs, Tempo for traces, Mimir for metrics, and integrations with systems like OpenTelemetry. If you want the plain-English version, it lets you ask, “What did the agent do?” and get a real answer instead of a shrug.
The topic gets sharper when AI agents are involved. Traditional software fails in somewhat predictable ways. AI agents can fail in weird ways. They may call the wrong API, repeat a bad action, or trigger a cascade in a system that looked fine five minutes earlier. That is why observability is not optional. It becomes a form of due care. A team has a duty to know what its tools are doing, especially when those tools can act on behalf of users.
Grafana is useful here because it does not force one narrow view. It works across stacks, clouds, and services, which is a relief because real systems are ugly. For background on the core observability pieces, the OpenTelemetry documentation is a solid reference, and Grafana’s own observability overview shows how the platform fits into modern ops work.
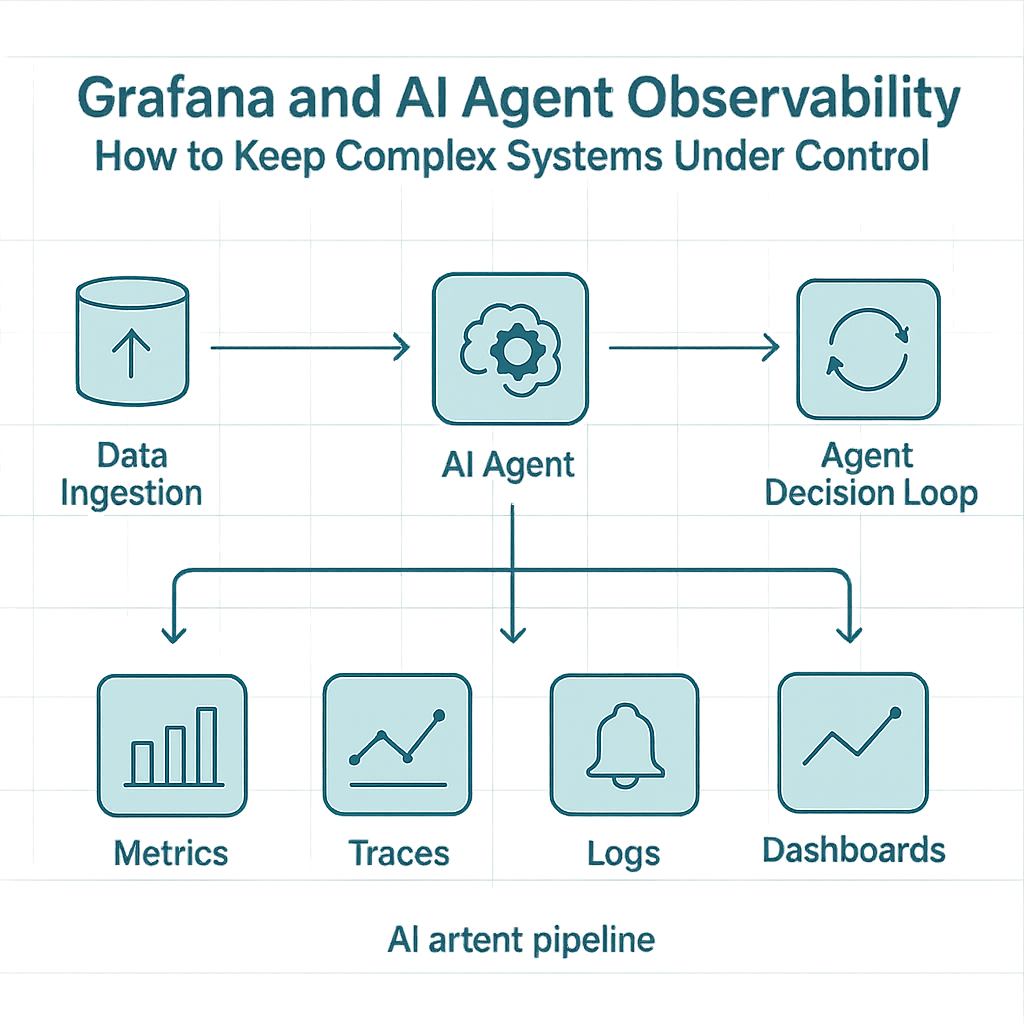
Core Benefits of Grafana for AI Agent Observability
- Faster fault finding. I have watched teams waste hours guessing at root causes because logs lived in one place, traces in another, and metrics in a third. Grafana reduces that scavenger hunt. You get one place to start, which is half the battle.
- Better control over agent behavior. AI agents can drift. They can keep making reasonable choices that add up to trouble. Dashboards help you spot odd patterns, like a spike in retries, extra token spend, or a loop of repeated tool calls.
- Clearer incident response. During a bad outage, people do not need poetry. They need clues. Grafana panels, alerts, and linked traces give responders a timeline, and time is what you need when the house is on fire.
- Lower waste. AI systems can burn through compute and API calls like nobody’s business. Observability helps you see cost hot spots before finance sends angry emails.
- Safer releases. If an AI agent or its surrounding service ships a bad change, dashboards can show error rate shifts, latency jumps, and odd usage trends right away.
Frankly, most teams say they want visibility, but what they really want is comfort. Those are not the same thing. Comfort is a feeling. Visibility is evidence.
When I worked on large distributed systems, the hardest bugs were never the loud ones. They were the quiet ones. A tiny rise in latency. A small increase in queue depth. A service that looked healthy but was slowly bleeding requests. AI agents make that even trickier because they can amplify small defects with machine speed. Observability gives you the chance to notice before the damage spreads.
If you want a wider view of modern monitoring practice, Datadog’s observability guide is useful for comparison, though Grafana’s open source model usually fits teams that want more control and less lock-in.
Step-by-Step Guide to Setting Up Grafana for AI Agent Observability
- Define what the agent is allowed to do. Start with the boring part. List the actions the agent can take, the services it can touch, and the failure modes you care about. No, “we’ll watch it later” is not a plan.
- Instrument the system before you need it. Add metrics, logs, and traces at the edges where the agent acts. I have seen teams bolt on observability after launch. That usually means they are blind when it counts. Use OpenTelemetry if you can, because it gives you a common path for data.
- Track agent-specific signals. Traditional app metrics are not enough. Watch token usage, tool-call counts, retry loops, confidence scores if they exist, and human override events. If the agent uses external APIs, track success rate and latency there too.
- Build dashboards for real questions. Do not make dashboards that look pretty and answer nothing. Make one for agent actions, one for service health, one for cost, and one for error bursts. In Grafana, keep panels simple and readable.
- Set alerts on outcomes, not noise. Too many alerts turn into wallpaper. Alert on high-severity patterns: abnormal action volume, repeated failures, unsafe state changes, or cost spikes. Grafana alerting can help here, but only if your thresholds make sense.
- Correlate agent activity with user impact. This step matters most. A system can look busy and still be useless. Tie AI actions to response time, failed jobs, cart abandonment, support tickets, or whatever outcome defines success in your case.
- Review and prune every week. I have never met a dashboard that was perfect on day one. Teams add panels, then forget them. Bad habit. Clean them up. Keep only the signals that still tell the truth.
For a practical setup path, Grafana’s Loki documentation and Tempo documentation are worth reading. They show how logs and traces can work together, which is exactly what you want when an agent makes a strange move and you need the full story.
Grafana vs the Biggest Competitor
| Feature | Grafana | Datadog |
|---|
| Deployment model | Open source, self-hosted, or managed | Mostly managed SaaS |
| Flexibility | Strong across many data sources | Strong, but more platform-bound |
| Cost control | Better for teams that want more control | Can get expensive as usage grows |
| Logs, metrics, traces | Unified through Grafana stack and integrations | Unified in one commercial platform |
| AI agent observability fit | Good if you want custom signals and open tooling | Good for quick rollout and packaged views |
| Best for | Teams that value openness and control | Teams that want fast setup and fewer moving parts |
Let’s be real. There is no magic winner for every team. If you want a single vendor to run the show, Datadog is hard to ignore. If you want open tooling, control over data, and room to shape your own signals, Grafana is the stronger fit. I prefer systems that let engineers own the plumbing. That habit saves trouble later.
The comparison also gets clearer when AI agents enter the picture. Agents create new, odd signals. They do not fit old dashboards nicely. Grafana’s open source setup makes it easier to add custom panels and unusual data sources without waiting for a vendor roadmap. That matters when your system behavior changes faster than product marketing can keep up.
For vendor-neutral guidance, the CNCF’s observability resources and OpenTelemetry specs are good anchors, because they push teams toward portable data instead of brittle silos.
Common Mistakes to Avoid.
- Treating observability like decoration. A lot of teams buy tools, then build dashboards nobody uses. That is not observability. That is wallpaper with charts.
- Watching only system health. CPU and memory are not enough when AI agents are in play. You need behavior signals, too. What did the agent decide? What did it call? What did it change?
- Ignoring trace context. I see this mistake all the time. Logs without trace IDs are like receipts with no store name. They may be true, but they are hard to use.
- Alerting on every tiny wobble. This drives people mad. If everything is urgent, nothing is.
- Forgetting human review. AI agents should not get a free pass because the dashboard looks green. Humans still carry the moral burden, and that is not something to hand over to a model.
Most guides say to set and forget your observability stack. I do not buy that. Systems rot. Behavior changes. New endpoints appear. A model update can change output quality overnight. If you do not review your dashboards and alerts, they become stale, and stale tools are worse than no tools because they make you feel safe.
When I was at Amazon, one hard lesson kept showing up: the fastest teams were not the ones with the fanciest tools. They were the ones that asked simple questions every day. What changed? Where did it break? Who is affected? Grafana helps answer those questions, but only if the team stays honest about what the data means.
If you need grounding in basic monitoring patterns, the AWS observability documentation is a decent practical reference, especially for teams already running on AWS.
Frequently Asked Questions
What makes AI agent observability different from normal observability?
AI agents take actions, not just process requests. That means you need to observe decisions, tool calls, side effects, retries, and business impact, not just service uptime.
Why use Grafana instead of a closed monitoring tool?
Grafana is flexible, open source, and works with many data sources. That makes it easier to track custom AI signals and avoid vendor lock-in.
Do I need metrics, logs, and traces for AI systems?
Yes. One signal alone is rarely enough. Metrics show trends, logs show details, and traces show the path of a request or action.
Can small teams use Grafana for this?
Yes. Small teams often benefit the most because they need clear visibility without paying for bloated tools they barely use.
Final Thought
Grafana is not a cure-all, and that is fine. It is a sturdy set of tools for people who want to see what their systems are doing, without pretending the machine will clean up its own mess. AI agents raise the stakes because they can move faster than your review process, and speed without truth is just a cleaner way to fail. I have seen enough of that in my years as Ermenildo Valdez Castro, Jr., and also as Ernie Castro, to know that the real prize is not automation alone. It is disciplined oversight, honest measurement, and respect for the work users trust you to do. Build that well, and the charts start to mean something. Skip it, and you are just guessing with nicer colors.