Grafana 13.3: Shared Dashboard Variables, Investigation Notebooks, and Safer AI Dashboarding
Grafana 13.3 adds shared variables and investigation notebooks, two public previews meant to reduce repeated setup and make it easier to preserve operational findings. The release also previews AI-assisted dashboard plans and a visual refresh, while making dashboard-edit undo generally available. I’m Ermenildo Castro, and I’ve spent years seeing small workflow gaps turn into avoidable team friction.
These changes address different parts of the same practical problem: engineers need to compare signals, explain what they found, and leave the next person enough context to act. A chart without a note can be hard to interpret; a note without the relevant chart is easy to distrust. Put them together, and an investigation becomes easier to repeat and review.
The main features are previews, so teams should check their rollout and configuration before making them part of a critical process. Grafana Cloud is rolling out Notebooks gradually, while self-managed installations need the relevant feature toggles for several previews. Here’s the useful distinction: the release offers new ways to organize monitoring work, not a reason to redesign every dashboard overnight.
What Is Grafana 13.3?
Grafana 13.3 is a Grafana Labs release that adds shared dashboard controls, investigation documents, and changes to Assistant dashboard building and the interface. Its most practical change for dashboard owners is cross-dashboard variables. A variable is a control such as an environment, region, service, or cluster selector. It changes which data a dashboard displays without requiring a viewer to edit each query by hand.
Before a shared variable, dashboard authors often had to recreate the same control on multiple dashboards. That sounds harmless until one copy gains a new value, another uses an old query, and a third has a slightly different name. In a 2021 GitHub discussion, a Grafana user described maintaining the same variables separately and warned that the differences could become unmanageable. That is not a grand technical mystery. It is maintenance work growing teeth.
Grafana 13.3 lets an editor define a variable once and make it available across dashboards. Global scope makes it available throughout a Grafana organization; folder scope limits it to dashboards in the same folder. An editor can add available shared variables from a dashboard’s sidebar, one at a time or all together. Viewers can still change the selected value on a dashboard, while the shared variable’s configuration stays centrally managed. Grafana’s dashboard variables documentation explains the broader role variables play in dashboard filtering.
I’ve seen this kind of duplication cause a confusing incident review: two service dashboards appeared to compare the same environment, but one selector had missed a recently added value. People spent time checking the service when the mismatch was in the dashboard setup. Shared definitions reduce that specific risk, though they do not prove a query is correct or guarantee that every dashboard uses the variable well.
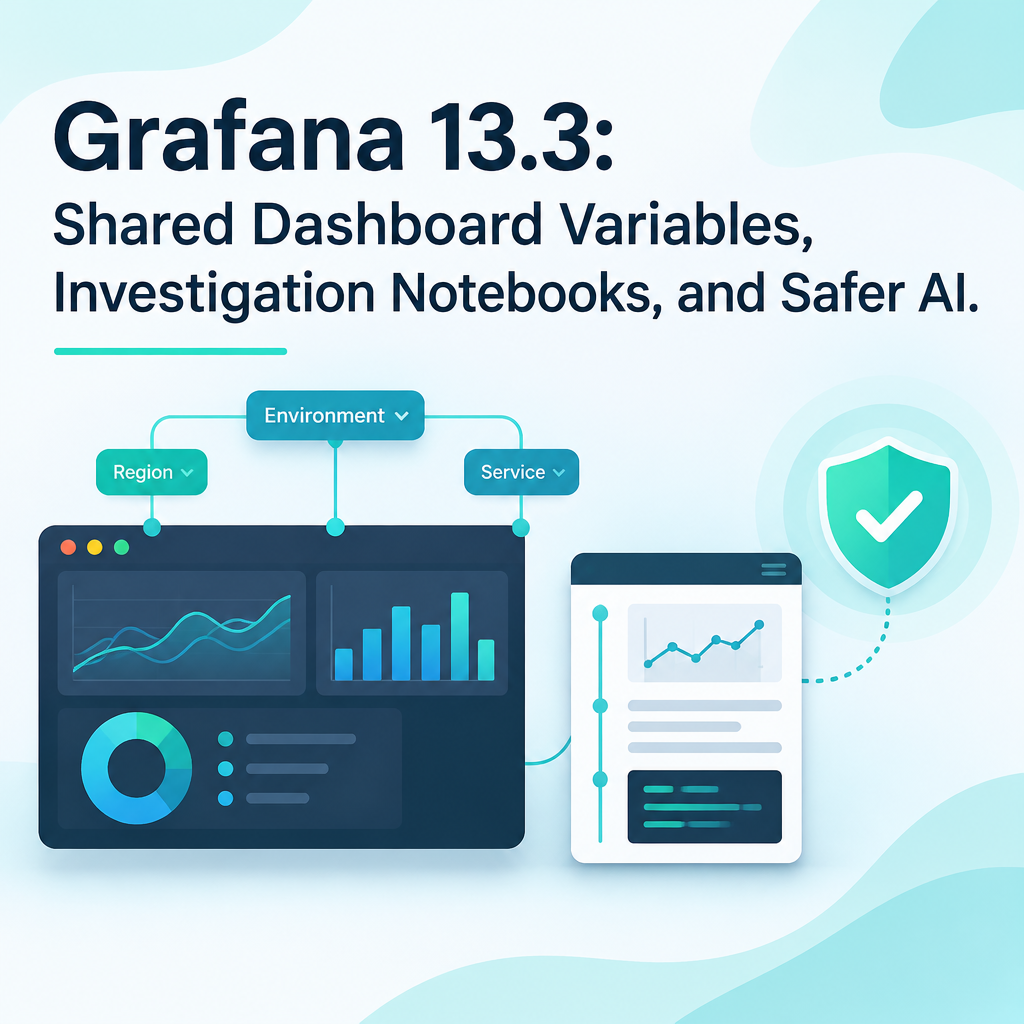
The release also adds Notebooks, documents that can hold panels from dashboards or Explore alongside written observations. Teams can create one manually or use Grafana Assistant, then save and share it. Assistant findings can also be included. Think of a notebook as a place to keep the evidence and the explanation together, rather than as another dashboard with a different coat of paint.
Other 13.3 changes affect how teams build and adjust dashboards. Assistant dashboard plans let a user review a proposed title, panels, visualization types, and variables in chat before building. A separate Undo turn feature restores the previous dashboard state after an Assistant edit, unless the dashboard has changed since that edit. The visual refresh is also a preview; Grafana says it preserves existing navigation and workflows and does not introduce breaking changes for plugins.
Core Benefits and Importance
A feature matters when it removes recurring work or makes a mistake easier to catch. Grafana 13.3 has several useful improvements, but they solve separate problems. Frankly, calling every release feature a productivity breakthrough is usually marketing. The test is whether it reduces effort without hiding important decisions.
- Less repeated variable setup. Teams can define shared controls once instead of keeping separate copies aligned. This is especially useful when a company has many dashboards that rely on the same region, environment, or service selector. Central management does not remove the need to check variable queries and permissions, but it cuts down on routine copying.
- Fewer chances for configuration drift. A dashboard copy can quietly fall behind its siblings. If the shared variable is managed centrally, teams have a clearer place to review its configuration. In my experience, the cost of a small mismatch is rarely the edit itself; it is the time several people spend deciding whether the data, the query, or the filter caused the difference.
- Investigation context stays with the evidence. A graph may show a spike, but it cannot explain why an engineer checked a particular service, what they ruled out, or what they plan to test next. Notebooks let teams keep panels beside observations. That can help with handoffs, incident reviews, and later investigations when the original participants are unavailable.
- A review step before AI-created dashboards. Dashboard plans show a proposed layout before the user chooses to build and save it. That gives the user a chance to catch an unsuitable panel or missing variable before the suggestion becomes a dashboard. AI can produce a draft quickly; it cannot know every team convention unless those expectations are made clear and checked.
- A safer way to correct Assistant edits. Undo turn can restore the earlier dashboard state after one Assistant request changes multiple panels. This is more useful than fixing each panel manually, especially during experimentation. The restriction matters: if the dashboard has changed since the Assistant’s edit, undo is unavailable.
- A visual update without a forced workflow reset. Grafana says the preview keeps existing navigation and workflows. Plugins that use standard Grafana components and theme tokens receive the refreshed appearance; plugins with custom styling can migrate separately. That gives teams a chance to check their setup before adopting the new look.
I once watched a team spend a review meeting comparing dashboards that were supposed to use the same filters. The charts were fine; the repeated controls were not. A shared variable would not have prevented every debate, but it would have removed one needless source of doubt. That is the quiet value here: reliable defaults leave people more time to investigate the system itself.
There is a human side to this, too. Monitoring tools shape who can understand a service and how quickly a teammate can pick up unfinished work. Good observability is a form of stewardship: useful records and clear controls respect the time and skill of the people who maintain systems. Grafana 13.3 gives teams some practical ways to do that, provided they review the results rather than trust the label on a feature.
Step-by-Step Guide to Trying Grafana 13.3 Features
Start with a small test. A preview is an invitation to evaluate a feature, not proof that it belongs in every production workflow. Here’s the kicker: a short trial with clear success criteria is more useful than turning on everything and hoping the team likes it.
- Choose one repeated dashboard control. Pick a variable used across a group of dashboards, such as a region or environment selector. Write down which dashboards need it and what values users should be able to select. Avoid beginning with a dozen controls; one familiar example makes the behavior easier to check.
- Confirm your Grafana setup. Cross-dashboard variables are a public preview across Grafana editions. For a self-managed installation, enable the
grafana.dashboardGlobalVariables feature toggle to try them. Grafana Cloud availability can differ by feature and rollout stage, so confirm what is available in your organization before writing a team procedure. - Create and scope the shared variable. Manage shared variables under Dashboards > Variables, rather than in the dashboard editor. Choose global scope if dashboards across the organization need the control. Choose folder scope when the control should apply only within a specific folder. Keep the scope narrow unless there is a clear reason to make it organization-wide.
- Add it to a test dashboard. Open the dashboard sidebar and add the available shared variable. You can add one variable or all available ones. Check that the displayed values make sense and that changing a selection changes the dashboard data as expected. Then repeat the check on a second dashboard. A shared control is only useful if both dashboards interpret it correctly.
- Check the viewer experience. Ask someone with viewer access to change the selected value. Confirm that they can filter the dashboard without gaining the ability to change the centrally managed variable configuration. Record any confusing labels or unexpected query results before expanding the change to more dashboards.
- Build a small investigation notebook. Notebooks are in public preview across Grafana editions. Grafana Cloud is rolling them out gradually; self-managed users need the
dashboard.notebooks feature toggle enabled. Create a notebook manually or through Grafana Assistant, add a panel from a dashboard or Explore, and write a short note about what the panel shows and why it matters. Save and share the document with a colleague to test the handoff. - Try Assistant dashboard plans on a low-risk task. Describe a monitoring need and review the proposed dashboard title, panels, visualization types, and variables in chat. Use the read-only preview to refine the plan before choosing to build and save. Check each panel against the data source and team conventions. A neat layout can still contain a wrong query or an unhelpful time range.
- Test undo and the visual refresh separately. Make a small Assistant edit, inspect the result, and try Undo turn before changing the dashboard again. Remember that undo is unavailable if the dashboard has changed since the Assistant edit. If you want to assess the visual refresh, self-managed installations can enable
grafana.visualDesignRefresh and switch back to the previous design. Test plugins with custom styling rather than assuming they will match automatically.
When I evaluate a new engineering workflow, I look for three things: fewer repeated steps, a clear review point, and a simple way to recover from a bad change. This release offers pieces of that pattern. Capture what you tested, what surprised you, and what you chose not to adopt. That record makes later decisions less dependent on memory or whoever happened to attend the first demo.

Comparison Table: Grafana Notebooks vs. Datadog Notebooks
Grafana’s Notebooks and Datadog Notebooks both bring charts and written context into a shared document. That makes Datadog a useful comparison, but the details matter more than a feature checklist. The table sticks to capabilities described for these products and the Grafana 13.3 release; it does not claim that one tool is best for every monitoring stack.
| Capability | Grafana Notebooks in 13.3 | Datadog Notebooks |
|---|
| Availability described here | Public preview across Grafana editions; Grafana Cloud rollout is gradual | Available through Datadog’s notebook workflow |
| Data and visual content | Panels from Grafana dashboards or Explore can be included | Live graphs can be combined with notebook text |
| Written investigation context | Written observations can sit alongside panels | Rich text can sit alongside graphs |
| Collaboration details in the release information | Notebooks can be saved and shared | Supports simultaneous editing and inline comments |
| Reusable incident material | Can be used to prepare a post-incident review | Includes reusable postmortem templates |
| Grafana Assistant connection | Assistant can create a notebook and its findings can be included | The listed comparison focuses on notebook collaboration and content |
The main practical difference is not a contest over who has more table rows. Grafana Notebooks fit naturally when teams already investigate through Grafana dashboards, Explore, and Assistant. Datadog’s documented features include simultaneous editing, comments, and postmortem templates, which may matter to groups that use those collaboration patterns. Check the Datadog Notebooks documentation for its current capabilities and product details.
New Relic offers another related workflow. Its Notebooks combine NRQL queries, visualizations, and Markdown, with natural-language query translation and notebook-wide variables; the release information states that the feature became generally available in August 2026. See New Relic’s Notebooks documentation for details. These products share a basic goal—keeping analysis and explanation together—but their query languages, data sources, collaboration tools, and release states differ.
Before selecting a notebook tool, ask where the investigation already happens. If your team relies on Grafana panels and Explore, moving the evidence to a separate system may add friction. If your incident process depends on simultaneous editing, inline comments, or an established postmortem template, check whether the chosen product supports that workflow. And if you need cross-platform evidence, test how links and screenshots behave before settling on a standard.
I would not choose based on a demo alone. Run the same short exercise in the tools your team is considering: record a service issue, attach the relevant chart, add the key finding, and hand it to someone who was not in the room. The best fit is the one that leaves that person with a clear next step, not the one with the most impressive product tour.
Common Mistakes to Avoid
New features can save time. They can also give teams fresh ways to make old mistakes. Most advice stops at “turn it on and try it,” but that skips the work that keeps a preview from becoming a source of confusion. Frankly, a feature toggle is not a rollout plan.
- Making every variable global by default. Global scope is convenient, but convenience is not a reason to expose a control everywhere. A region selector that only makes sense for one service group belongs in a narrower scope. Choose folder scope when it fits, and make the intended audience clear to dashboard editors.
- Assuming shared configuration means shared meaning. A centrally managed variable can still be used in a way that produces confusing results. Check the queries and values on each dashboard where you add it. Ask whether a selection represents the same thing in every data source. If it does not, sharing the label alone may make comparisons worse, not better.
- Treating a Notebook as a pile of charts. Panels without dates, observations, or a question leave readers to guess why they are there. Add a short note that says what you noticed, which checks you performed, and what remains uncertain. Separate confirmed findings from guesses. That simple habit is useful in an incident review and fair to the next person who has to act on your notes.
- Trusting an Assistant plan because it looks polished. A proposed dashboard can have a tidy title and sensible-looking visualizations while still using the wrong field or an incomplete filter. Review the plan, then check the built panels against the actual data and the question you need to answer. Treat Assistant output as a draft from a fast helper, not as an approval from a subject-matter expert.
- Expecting undo to work after later edits. Undo turn restores the previous dashboard state after an Assistant edit, but it is unavailable if the dashboard changed afterward. If an edit is important, inspect it before moving on. For a high-impact dashboard, keep an appropriate change process and do not rely on one undo control as your only recovery plan.
- Assuming every plugin will look identical after the refresh. Grafana says plugins using standard components and theme tokens pick up the refreshed appearance. A plugin with custom styling may need a separate migration. Test the preview with your actual plugins, note any issues, and keep the ability to switch back in mind for self-managed installations.
- Turning on previews without telling users. A newly shared variable or changed interface can surprise dashboard viewers, even if the underlying data is unchanged. Tell users what has changed, where they can adjust a selected value, and where to report a mismatch. Clear communication is cheap compared with a week of people wondering whether a graph moved because the service changed.
A sound rollout has an owner, a test case, and a way to report a problem. I’ve seen technical teams spend more time debating who changed a dashboard than checking the alert that prompted the meeting. A short change note and a clear rollback route would have helped. No tool removes the need for care; good tools make careful work easier to repeat.
Frequently Asked Questions
Are cross-dashboard variables available in every Grafana edition?
Grafana describes cross-dashboard variables as a public preview across all editions. That does not mean every deployment has them enabled automatically. Self-managed installations need the grafana.dashboardGlobalVariables feature toggle enabled to try the preview. Availability and rollout details can change, so check the Grafana 13.3 release notes and the configuration for your own installation before planning a broad rollout.
Can dashboard viewers change a shared variable?
Yes. Viewers can change the selected value on a dashboard, while the shared variable configuration remains centrally managed. That difference is useful: someone can filter a dashboard to a region or environment without becoming responsible for editing the shared definition. Test the behavior with the access level your team actually uses, and make sure the variable’s available values and meaning are clear to viewers.
How do self-managed users enable Grafana Notebooks?
Self-managed installations need the dashboard.notebooks feature toggle enabled. Grafana Notebooks are in public preview across editions, while Grafana Cloud is rolling the feature out gradually. Once available, a user can create a notebook manually or through Grafana Assistant, add panels from dashboards or Explore, include observations, then save and share it. Check the current release documentation for setup details and any changes to the preview.
What happens if the Grafana Assistant changes the dashboard after an edit?
Undo turn can restore the previous dashboard state after an Assistant edit, including a request that changed multiple panels. It is generally available across Grafana editions. However, undo is unavailable if the dashboard has changed since the Assistant’s edit. Review edits promptly and use your normal change-control or backup practices for important dashboards. For the related feature details, see Grafana’s dashboard and release documentation.
Grafana 13.3 is most useful when teams apply it to a real annoyance: copied filters, investigation notes scattered across chat, or dashboard edits that are hard to review. Start with one workflow, test it with the people who use it, and keep the parts that genuinely reduce confusion. I’m Ermenildo Castro, and I’d rather see a team leave one clear, trustworthy investigation record than enable every preview on day one.